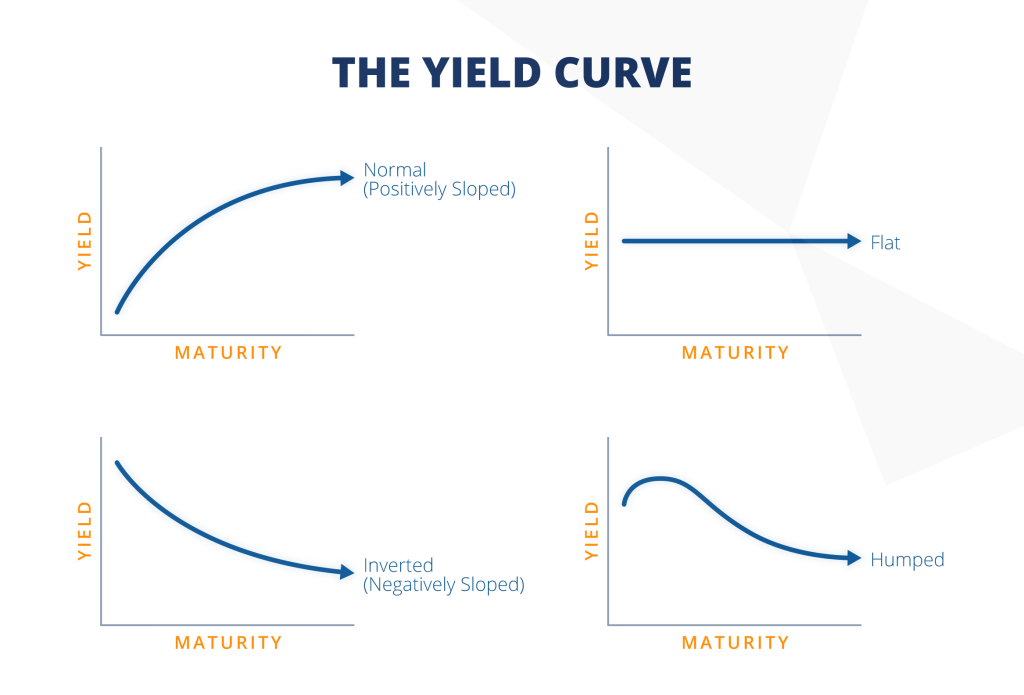
The “Yield Curve” is a graph that plots the interest rates of bonds with different maturity dates. Normally, it slopes upward: you should get paid more for lending money for 30 years than for 2 years.
An Inversion happens when short-term rates are higher than long-term rates. This is the bond market’s way of screaming that a recession is coming. It means investors are so worried about the immediate future that they are “locking in” long-term rates, and they expect the central bank will have to cut rates soon to stimulate a crashing economy. It is the most reliable “Early Warning System” in finance.